
Last Updated: September 21, 2026
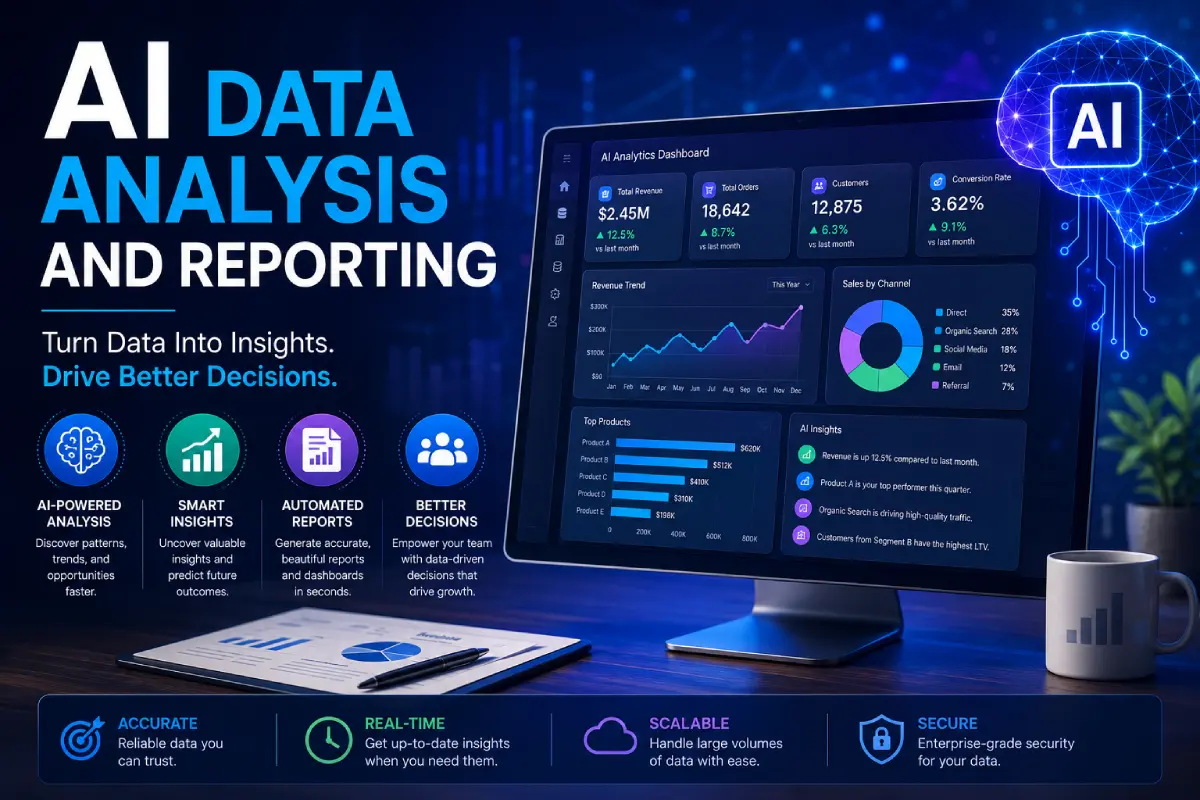
AI data analysis and reporting has revolutionized the process for businesses to gather, analyze and interpret data. No longer do businesses need to spend hours cleaning spreadsheets, creating charts, and manually looking for trends. Artificial intelligence can analyze large sets of data, identify popular trends, produce insights, and generate reports in a fraction of the time.
If you are a company who operates in the sales data, customer behavior, marketing and effectiveness, financial data, website data, or operational data spaces, then using AI analysis might allow your data to become much simpler to interpret and utilize. This document provides an overview of what AI data analysis and reporting is, how it works, the benefits it provides, typical use cases, any limitations, and how organizations can get started.
“For the overarching strategy, read our complete guide on Productivity and AI.”
What Is AI Data Analysis and Reporting?
AI data analysis and reporting is the application of artifical intelligence and machine learning to analyze data and identify significant patterns, provide insights, and roll up all of the information into a comprehensible report
Traditional data analysis often requires a person to:
- Collect data or information from various sources.
- Manage and prepare the information for input.
- Custom formulas and calculations.
- Observe trends and discrepancies.
- Constructs charts and dashboards.
- Prepare a report describing what you have discovered.
- Distribute the report to the relevant individuals in the organization.
AI can handle much of that.
For instance, a business can give an AI-based analytics application sales records spanning various months. More insightful information could include what products are expanding the most, what geographic areas are lagging behind, what periods experience sales surges, and which customer segments are most profitable.
It‘s not about just automating a report. What makes it valuable is the ability to take raw data and transform it into actions.
How Does AI Data Analysis and Reporting Work?
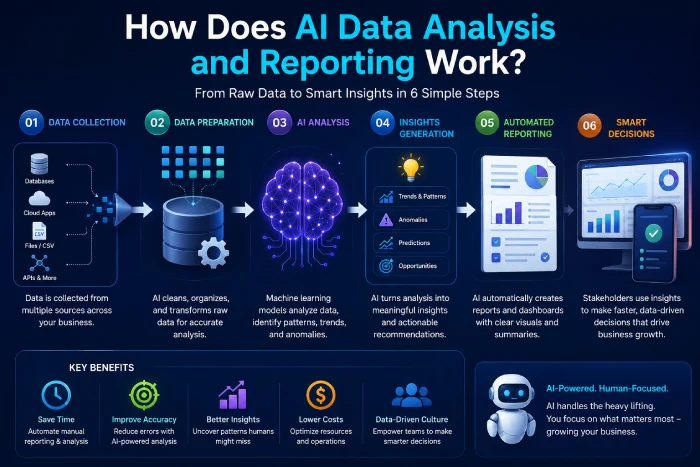
Automated data analysis empowered by artificial intelligence (AI) is usually a merging of data processing, applying machine learning techniques, natural language processing and generating automated reports.
A typical workflow looks like this:
Data Sources 2 Data Preparation 2 AI Analytical 2 Insight 2 Reporting 2 Business Decision2 1
1. Data Collection
The first step is to gather data sources from which to source information, namely:
Depending on the business, data might come from:
- CRM platforms
- Sales systems
- Accounting software
- Website analytics
- Marketing platforms
- Looking at customer support systems.
- Spreadsheets
- Databases
- E-commerce platforms
- Social media sites
- Inventory systems
AMI reporting tools enable multiple data sources to be aggregated and consolidated into a single location.
2. Data Cleaning and Preparation
Raw data is usally not so clean. It can also have duplicate records, null values, inconsistent formats, wrong data or inaccurate information. The advantages of AI tools is can detect these problems and ready datasets for analysis.
For instance, the AI might identify that “United States,” “USA” and “US” refer to the same country and normalize these values. This step is necessary because low data quality can lead to false results.
3. AI-Powered Analysis
After the data has been compiled, AI algorithms can then examine the data to find correlations.
Depending on the system, AI may perform:
- Trend analysis
- Predictive analysis
- Customer segmentation
- Anomaly detection
- Correlation analysis
- Forecasting
- Classification
- Performance analysis
- Sentiment analysis
This provides the opportunity for businesses to explore such questions that would be overly difficult and/or time-consuming to answer themselves.
4. Insight Generation
The task then becomes translating analysis into insights. The AI system can summarize what is important rather than dumping thousands of rows in a spreadsheet.
For example:
Throughout the quarter, revenue grew, although growth was limited to two product segments and revenues in several regions declined. This sort of abstraction provides those involved in the decision-making process with a initial basis for further inquiry.
5. Automated Reporting
AI then can publish the insights in the form of reports, dashboards, summaries, or presentation.
Reports can include:
- Most important performance indicators.
- Charts
- Tables
- Trend summaries
- Comparisons
- Forecasts
- Anomalies
- Recommendations
- Executive summaries
Certain sites are able to automatically provide reports for day-to-day, weekly and monthly.
Key Benefits of AI Data Analysis and Reporting
There are also many reasons a business will use AI enabled analytics.
Faster Data Analysis
This rapid procedure means that one of the biggest advantages is the speed. It might take hours and even days for the employees to analyze manually, to merge different data sources, to derive metrics and to generate report. AI can much more rapidly process large quantities of structured data.
This also provides teams with more time to consider the results and develop a conclusion.
Reduced Manual Reporting
Repeated report. The same time that the salesperson spends preparing its sales report, market report, financial analysis or operational scorecard weekly, for example
AI offers the potential to automate some or all of this process. Then, report workflow can be set up and the system will be able to gather, analyze data and generate a new report;
Easier Access to Insights
In a company not everybody knows how to write SQL queries, design complex Excel formulas or to use business intelligence tools. AI is also helping to democratize analytics.
With natural-language interfaces, users may be able to ask questions such as:
- “Any reasons for the fall in sales last month?”
- “Which products were most profitable?”
- “Identify the most rapidly expanding customer group.”
- What marketing channel has the most effective conversion rate?
- Are there anomalies in our data?
Then the system will give an analysis according to the data.
Better Decision-Making
Quality business decisions require good information. Use AI data analysis. AI data analysis can help decision-makers recognize trends and understanding relationships more quickly that otherwise might have taken longer.
For instance a retailer may find that customers who purchase a certain product are ‘two or three times more likely than average to buy a second product in the 30 day window.’.
This observation may impact cross-sell campaigns and product placement.
Real-Time or Near Real-Time Monitoring
Standard reports are usually generic and generated periodically.
Artificial Intelligence driven dashboards could also give you a more frequent flow of updates if they were configured to connect to live or yet refreshed data sources.
This will enable the companies to recognize problems earlier.
For instance, a team responsible for operations might be notified when an important metric is substantially outside its usual value.
Improved Data Visualization
AI reporting systems have the potential for bringing sophisticated data analysis to visual form.
Depending on the use case, reports may include:
- Bar charts
- Line graphs
- Pie charts
- Heatmaps
- KPI cards
- Trend lines
- Geographic maps
- Forecast charts
A good visualization explains to the decision-maker what the numbers tell.
Common Use Cases for AI Data Analysis and Reporting
AI data analysis and reporting can be used in practically all functions within a business.
Sales Analysis
Sales teams can use AI to analyze:
- Revenue trends
- Sales performance
- Conversion rates
- Customer acquisition
- Average order value: Simply put, this is the average amount a customer spends in a single transaction. To find this ratio, total revenue (sales) is divided by the total number of transactions in the database over a given period.
- Sales pipeline
- Product performance
AI can assist in pinpointing “at risk” deals or high growth potential customer segments.
Marketing Analytics
Marketing team produce data due to the existence of a large number of sources.
AI will: be able to monitor campaign activity, including: traffic, conversions, engagement, customer acquisition costs.
The analysis can be layered for example, an AI report may analyze a variety of marketing channels and indicate which produces the best return for the money spent.
Financial Reporting
Financial teams use AI to examine revenue, costs, money flowing in and out, budgets and financial results.
Allows detection of anomalies and irregularities by AI. Transfers of funds offer, compare actual result with forecast and significant differences.
Financial control by Human is needed even if reporting is done through Human, especially for reports that impact accounting, regulatory compliance, taxation, or significant financial decisions.
Customer Analytics
Companies can use AI for customers behavior.
Analysis may include:
- Purchase patterns
- Customer lifetime value. The value of a customer to the company over the full length of the relationship, often used for long-term investment decisions. The overall amount of purchase expenditure a consumer spends over their entire relationship with a company.
- Retention
- Churn
- Customer segments
- Support interactions
- Satisfaction trends
These lesson points can help companies excel their clients and strengthen good relationships.
Operations and Supply Chain
Operations teams can monitor inventory, delivery time, production performance, equipment information, operating costs among other things.
Anomaly detection can also be advantageous when companies require identification of abnormal activity at a rapid rate.
Website and SEO Reporting
Combine, extract and blend data from the various digital silos of web analytics, search, conversion and content metrics.
AI can help identify:
- Traffic trends
- High-performing pages
- Declining pages
- Conversion opportunities
- Performance of searches.
- Content gaps
- Number of User Requests:The number of user requests has remained steady for the most part. Some fluctuations can be attributed to changes in how users utilize the service. Number of User Errors: Errors made by the user seem to occur mostly randomly and do not have any obvious cause.
Teams can use the power of AI to cross-reference different scores and find possible explanations instead of examining individual scores individually.
AI Data Analysis vs. Traditional Data Analysis
The first point is that AI by itself does not substitute for traditional analytics.
But instead, it alters how the people interact to data.
| Traditional Data Analysis | AI Data Analysis |
| Additional manual processingoffzip; | More automation |
| These are querying pictures searching out information. Loading predefined search heads onto users’ reasons. By embedding a search interface in itself. (Bunge, 1993 in Stufflebeam et al., 2000) | Can support questions in natural language. |
| Manual creation of reports | Generation of reports. The ability to automate reports is crucial. |
| Searches for pattern among the human reliance on image; people find patterns in what they see so their search is for meaning in different forms. | AI throws around the phrase. It is used in different contexts. |
| Static reporting is a very prevailing form. | Dynamic analysis is possible |
| May need more advanced skills | Will be easier for non-technical users to understand: |
Sounds.logical.. Instruments that are delicate are still perfect for deep analysis and localized reporting.
Another layer that AI brings is the potential to make it even quicker and more accessible.
Challenges of AI Data Analysis and Reporting
AI analytics offers huge benefits, but businesses need to be aware of its limits.
Data Quality Problems
AI will not be able to save data that is intrinsically unreliable.
If the data fed into the analysis is not complete, accurate, up-to-date or even balanced; then the results produced may be flawed.
A business should develop a well-defined data-quality process before over-relying on AI output.
Incorrect AI Interpretations
Sometimes, at an AI level, the algorithms or the system as a whole can just get the wrong answers to data or come to conclusions that seem logical but are in fact incorrect.
Consequently, critical business decisions should never be made in exclusively automated environment.
If something is compelling,users may want to check it against the data.
Privacy and Security
Business data sets may include time sensitive, proprietary or confidential information, customer records, financial data, or other data.
Is the information being stored, accessed, and protected by the AI platform?
Implement access controls, encrypt, data govern and grant appropriate permissions.
Lack of Context
Artificial intelligence can discover statistical correlations even if it has no actual knowledge of the task environment.
For example, a sudden decline in sales could be due to price changes, supply issues, seasonal effects, a competitor‘s promotion, or an outside shock.
While AI might catch the change, human knowledge might be needed to understand why it was changed.
Integration Challenges
Business people, or the enterprise itself, may have distributed information…
Integrating data from CRM, finance, marketing, inventory, and the site may involve some considerable work.
A successful AI reporting approach can as the word goes not only relies on the AI model but also relies on the quality of the data platform
“To take the next step, see our detailed guide on AI Customer Support Automation.”
How to Implement AI Data Analysis and Reporting
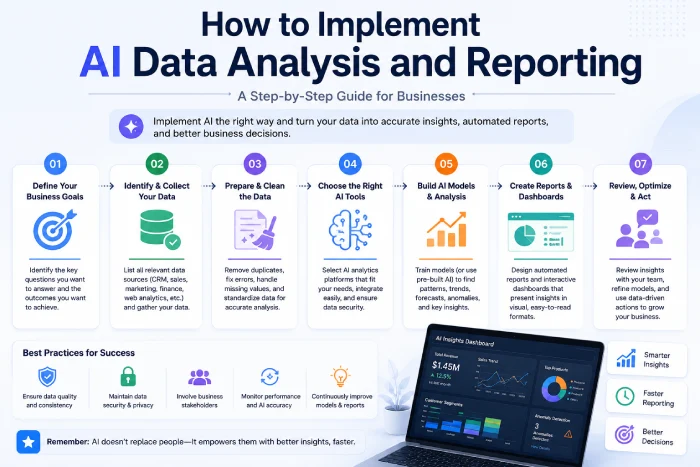
A business doesn‘t have to go from nothing to fully automatic. Practical you‘ll probably find it difficult to put pressure on those areas to start with, so be more gradual.
Step 1: Define the Business Objective
Begin with a well defined issue.
For example:
- Decreased reporting time.
- Enhance sales forecasting.
- Build a relationship with the customer by seeking to understand the churn.
- Keep an eye on marketing performance.
- Elucidate operational issues.
It is important to have a well-defined goal, which makes it easier to get the value in the beginning.
Step 2: Identify Your Data Sources
Specify the systems that provide the information you need.
Identify the source of the data, the rate it updates, and the party that owns it.
Step 3: Improve Data Quality
Prior to adoption of sophisticated AI analytics, continuously clean up duplicate, inconsistent, and incomplete information.
The quality of the data contributes to the usefulness of the analysis.
Step 4: Choose the Right AI Analytics Solution
Each business is unique in its own way.
Consider factors such as:
- Supported sources of data This involves information that may be obtained through the sources listed below.
- Integration capabilities
- Security
- Reporting features
- Visualization
- Natural-language analysis
- Automation
- Scalability
- Pricing
- User permissions
Don‘t pick a platform based on how many different AI features it has.
The best solution is the one that solves the business problem effectively.
Step 5: Start With a High-Value Use Case
Choose one reporting process that consumes significant time or provides clear business value.
For example, automate a weekly sales performance report before attempting to automate every department.
Step 6: Add Human Review
AI-generated reports should have appropriate human oversight.
Employees should review important insights, investigate unusual findings, and verify information before it is used for major decisions.
Step 7: Measure the Results
Track whether the AI system is actually improving the process.
Useful measurements include:
- Hours saved
- Reporting accuracy
- Time to insight
- User adoption
- Decision-making speed
- Reduction in manual work
- Business outcomes
If the system saves employees several hours every week while improving reporting quality, the implementation is producing measurable value.
Best Practices for AI Data Analysis and Reporting
To get better results, businesses should follow a few basic principles.
Start with clean data.
AI analytics works best when the underlying information is accurate and consistent.
Keep humans involved.
AI should support decision-makers rather than automatically make every important decision.
Use clear metrics.
Define exactly what each KPI means and how it should be calculated.
Avoid unnecessary complexity.
A simple report that answers important business questions is often more useful than a dashboard filled with dozens of metrics.
Protect business data.
Use appropriate security, access controls, and governance policies.
Test AI-generated insights.
Important conclusions should be checked against source data.
Improve continuously.
As business requirements change, reporting workflows and AI models should be reviewed and updated.
The Future of AI Data Analysis and Reporting
AI data analysis is moving beyond simple dashboards and automated summaries.
Future analytics workflows are likely to become increasingly conversational and proactive.
Instead of waiting for employees to open a dashboard, AI systems can identify significant changes and bring them to the user’s attention.
For example, an analytics assistant might say:
“Revenue is 12% below the expected range this week. The largest decline comes from the enterprise segment, while product returns have increased.”
The next step could be asking the system to investigate the decline, compare it with previous periods, and prepare a management report.
This shift from passive reporting to proactive intelligence could make business analytics much more useful.
However, accuracy, transparency, security, and human oversight will remain important as businesses become increasingly dependent on AI-generated insights.
Final Thoughts
AI data analysis and reporting can help businesses turn large amounts of information into faster, clearer, and more actionable insights.
From sales and marketing to finance, customer analytics, operations, and website performance, AI can reduce repetitive reporting work while helping teams discover patterns that might otherwise be overlooked.
The most effective approach is not to replace human decision-making completely.
Instead, businesses should use AI to handle repetitive analysis, surface important trends, automate reports, and give employees better information to work with.
When combined with clean data, strong security, clear KPIs, and human oversight, AI data analysis and reporting can become a powerful part of a modern business intelligence strategy.
FAQs About AI Data Analysis and Reporting
What is AI data analysis and reporting?
AI data analysis and reporting uses artificial intelligence to process data, identify patterns, generate insights, and automatically create reports or dashboards.
Can AI analyze Excel and spreadsheet data?
Yes. Many AI-powered analytics tools can work with spreadsheet data, depending on the file format, platform, and available integrations.
Is AI data analysis better than traditional analysis?
AI can make analysis faster and more accessible, but it does not completely replace traditional analytics. Human expertise remains important for validation, context, and strategic decision-making.
Can AI create business reports automatically?
Yes. AI-powered reporting systems can automate recurring reports, summarize performance, identify trends, and present information through dashboards or written summaries.
Is AI data analysis secure?
Security depends on the specific platform and how it is configured. Businesses should evaluate data protection, encryption, access controls, privacy policies, compliance requirements, and data-retention practices before using AI with sensitive information.