
Last Updated: September 23, 2026
Network monitoring devices and programs enable IT staff to monitor activity on routers, switches, firewalls, servers, access points, applications and all other attached infrastructure. With monitoring tools in place, administrators can proactively determine the availability, performance, bandwidth and security concerns rather than wait for disgruntled employees to call in.
The current generation of network monitoring solutions are more than just simple up checks. Quite a number of monitoring solutions are capable of gathering SNMP data, monitoring bandwidth and packet loss, CPU and memory utilization, creating alerts, generating historical views, and integrating with other IT management solutions.
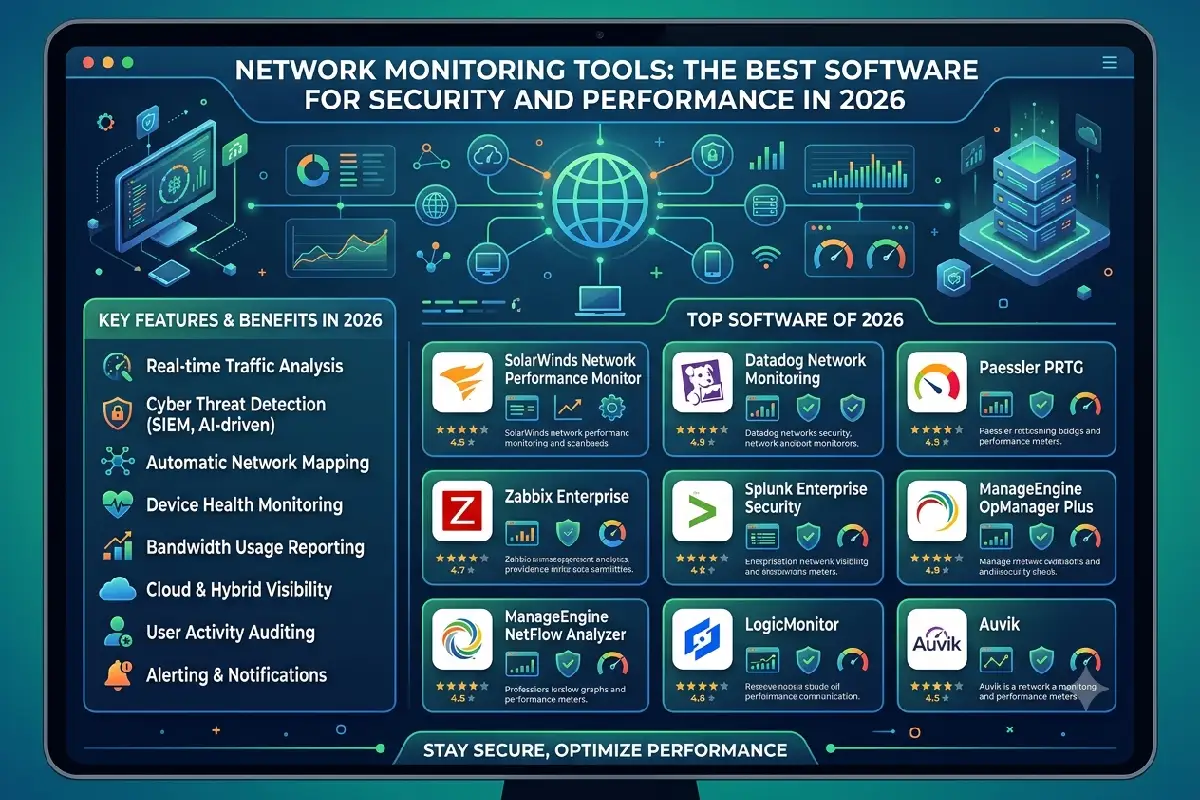
By 2026, organizations will have the option of free open-source platforms (Zabbix, Nagios Core), commercial network management platforms (PRTG, SolarWinds), or more general observability platforms (Datadog).
Therefore, the right choice can be affected by factors such as the size of the network, the degree of technical skill, the budget, deployment model, and the kind of visibility needed.
Why Network Monitoring Matters
Even while everything “seems to be working” serious problems still may be happening to the network. A switch may remain online while one interface develops errors. Inhternet connection will persist without detection when there is high latency and packet loss, preventing any video meetings from occurring.
Network monitoring provides continuous visibility into these conditions.
The software that monitors can gather data on the status of interface, bandwidth used, packets lost, latency, CPU load, RAM, temperature readings, and other device specific data. Zabbix can use SNMP 1 2c 3and measure traffic, interface errors, link status, device availability, CPU, RAM and hardware sensors.
Historical data is useful as well. A network administrator can look at traffic from weeks or months past to see if there is a pattern for capacity.
Problem solving and planning benefit from monitoring.
Monitoring Performance
Performance monitoring helps answer questions such as:
- What is causing the network to run slowly?
- Which interface is consuming the most bandwidth?
- Is packet loss increasing?
- Which device is approaching capacity?
- How long has the problem been happening?
For instance, if an uplink shows high utilization all the time, this could signal the need to add capacity or optimize traffic flows.
Improving Network Security
Network monitoring is not a substitute for firewalls, endpoint protection, intrusion detection, or other security controls. It can provide valid operational evidence.
High incoming or outgoing traffic, frequent disconnects or changes of device, variation in the operation of a service may all be signals indicating that an administrator should investigate.
Some monitoring products are capable of generating alert notifications based on unexpected variation in network data points. Zabbix offers threshold-based, anomaly detection, alert dependency, and escalation workflows.
Reducing Downtime
The earlier that a problem with infrastructure is identified, the earlier the IT team is able to investigate it.
Monitoring can identify the router that is no longer available, the service that has failed, the server that is no longer reachable, or the interface that is overloaded, before the user has had to notify it.
What Should Network Monitoring Software Track?
Specifics will vary by environment, but many networks should consider viewing the following three categories:
| Metric | What It Shows | Why It Matters |
| Device availability | Whether equipment is reachable | Detects outages |
| Latency | Network response time | Helps identify slow connections |
| Packet loss | Lost network packets | Indicates connectivity problems |
| Bandwidth | Traffic consumption | Helps identify congestion |
| CPU usage | Device processing load | Detects overloaded hardware |
| Memory usage | Available device memory | Identifies resource pressure |
| Interface errors | Transmission problems | Helps diagnose physical or configuration issues |
| Temperature | Hardware operating condition | Helps prevent overheating |
| Uptime | Continuous operating time | Useful for reliability analysis |
SNMP is especially relevant, as it enables an overseeing system to gather data from large numbers of network elements. Contemporary platforms are also likely to involve a mix of SNMP with agents, APIs, flow data, logs, synthetic testing and cloud telemetry.
Best Free Monitoring Tools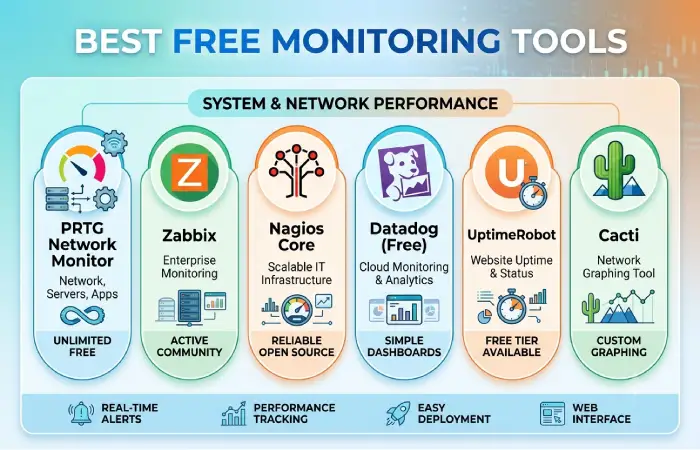
Free network monitoring software can be a practical choice for home labs, small businesses, educational environments, and technically experienced IT teams.
However, “free” does not necessarily mean effortless. Open-source platforms could have higher demands of configuration, maintenance, Linux administration, database management or troubleshooting in comparison with commercial products.
Zabbix
Zabbix Opensource monitoring system can monitor network and general IT infrastructure, gathers data via snmp and agent, offers historical data, dashboards, alerting, automation and reporting.
Network monitoring features encompass traffic, bandwidth, packet loss, interface errors, link status, CPU, memory and hardware info. Zabbix also supports automatic device discovery and provides templates for popular network hardware vendors.
Zabbix is available at no software licensing cost and uses the AGPLv3 license for versions beginning with 7.0.
The disadvantages are that the organizations need to be very comfortable with managing and configuring the monitoring environment.
Nagios Core
Nagios Core is yet another reliable open source monitoring platform. Its main features are the ability to monitor firewalls, routers, switches, servers, applications, websites, services and other infrastructure elements.
Its greatest asset is the plugin architecture. It includes a set of official plugins and many third-party plugins.
Nagios Core is GPLv2 licensed, and is free to use.
Due to its intrinsic flexibility to be configured to suit the needs of an adminstrator who wants a monitored check built exactly for them. More of a technical setup than a modern commercial system. Nagios the Core in specific admits to have high reliance on configuration of files and commands users workflows, Nagios XI strives to cover this with a graphical based administration.
Other Open-Source Options
Additionally, IT teams can consider using the supports for Cacti, and LibreNMS, OpenNMS etc.
The projects have some variations in how they discover devices, their graphs of operation, alert system, integrations, and traffic monitoring. Examine the documentation of an open-source platform first to determine that it offers the network device types and data attributes.
Enterprise Monitoring Platforms
Enterprise environments often need more than basic device availability.
There are thousands or hundreds of devices in large network, scattered across offices, data centers, cloud services, remote locations and hybrid infrastructure, etc.
Most large enterprise monitoring platforms offer:
1) one or more centralized dashboards
2) automatic discovery of web sites
3) role-based access
4) reporting
5) 3rd-party integrations
6) support
7) scalable data collection.
PRTG Network Monitor
PRTG which is a popular commercial monitoring platform that use sensors. This sensoring model enable the user organizations to monitor bandwidth, availability, traffic, CPU, memory & services.
The sensor based approach adds a lot of flexibility to PRTG, but it‘s important for organizations to know how the required monitoring configuration maps onto licensing.
May be helpful for organizations that seek a middle ground by providing a unified view without developing a comprehensive monitoring system from open source parts.
SolarWinds Network Performance Monitor
SolarWinds Network Performance Monitor is most likely not service delivery driven.
It is applicable when the organization requires centralized management on routers, switches, interfaces, and network performance through out the large environment.
Commercial network monitoring products can reduce the amount of custom engineering required compared with building a monitoring stack entirely from open-source components.
Datadog
Datadog takes a broader observability approach.
Instead of focusing exclusively on network devices, organizations can correlate network information with infrastructure, applications, logs, and cloud services.
This can be useful for modern environments where an application problem may involve multiple layers of infrastructure.
The important distinction is that network monitoring and full-stack observability are not always the same requirement. A business primarily interested in switch interfaces and SNMP metrics may need a different platform from a cloud-native company investigating application performance across multiple services.
Network Monitoring Tools Compared
The comparison below is between like features of each platform, rather than a blanket statement about the superiority of one platform over others.
| Tool | Model | Typical Use | Key Strength |
| Zabbix | Open source | Networks and IT infrastructure | Flexibility and customization |
| Nagios Core | Open source | Networks, servers, services | Plugin ecosystem |
| PRTG | Commercial | Small to large infrastructure | Sensor-based monitoring |
| SolarWinds NPM | Commercial | Enterprise networks | Network performance management |
| Datadog | Commercial/cloud | Hybrid and cloud infrastructure | Broader observability |
| OpenNMS | Open source | Larger infrastructure | Network management and monitoring |
| Cacti | Open source | Performance graphing | Time-series network data |
Current 2026 comparisons also show that network monitoring is increasingly divided between traditional infrastructure monitoring and broader observability platforms. Modern tools may combine infrastructure metrics, traffic analysis, cloud telemetry, path visibility, and synthetic testing.
Alerting and Reporting Features
Monitoring without useful alerts can create another problem: too many notifications.
A network monitoring system should distinguish between events that require immediate attention and conditions that can simply be recorded for later analysis.
For example, a completely unreachable core router may require an urgent alert. A gradual increase in bandwidth usage may only require a capacity-planning notification.
Configure Thresholds
Thresholds specify the value above which monitoring will issue an alert.
A basic example might be:
- Warning: interface utilization exceeds 70%.
- Critical: interface utilization exceeds 90%.
- Emergency: device becomes unreachable.
The exact values should be based on the environment rather than arbitrary numbers.
Reduce Alert Noise
Alert dependencies can prevent multiple notifications from being generated for the same underlying failure.
Suppose a switch loses power. Monitoring software could report the switch as unavailable along with several connected devices. If dependencies are configured correctly, administrators can focus on the likely root device instead of receiving dozens of separate alerts.
Zabbix supports dependencies, escalation logic, maintenance suppression, and different notification schedules.
Reporting and Historical Analysis
Reports help organizations understand how their networks behave over time.
Useful reports can include:
- Bandwidth utilization
- Device availability
- Interface errors
- Packet loss
- Network capacity
- Outage duration
- Alert frequency
- Resource utilization
Historical data can also help justify hardware upgrades.
If an uplink has consistently approached its practical capacity for several months, the data provides stronger evidence for capacity planning than a single slow-network complaint.
Setting Up Network Monitoring
A basic network monitoring deployment does not need to begin with every device in the organization.
Start with the infrastructure that has the greatest operational importance.
Step 1: Inventory the Network
Make a list of switches, routers, firewalls, servers, access points, internet connections and critical services.
Record their IP addresses, locations, roles, and ownership.
Step 2: Select Monitoring Metrics
Select the measures that are significant.
For network devices, these may include availability, interface status, bandwidth, errors, packet loss, latency, cpu, memory and temperature.
Do not bother to monitor each and every metric that your tool has.
Step 3: Enable Appropriate Access
SNMP is widely used for network-device monitoring.
When practical, utilize the SNMPv3 protocol as it offers the functionality of authentication and encryption, both of which are absent in the legacy SNMPv1 and SNMPv2c protocols.
Limit access to monitoring to only the system(s) authorized to be accessed, and adhere to the security advice for your network equipment.
Step 4: Add Devices
First add all the critical firewalls, routers, switches, and servers.
Many of the monitoring platforms offer discovery mechanisms that can help in automating identification of the various interfaces, and devices. An example would be Zabbix that offers network discovery and auto registration of new devices.
Step 5: Create Dashboards
Build dashboards around practical questions.
A network operations dashboard might show:
| Dashboard Area | Example Information |
| Availability | Devices currently online/offline |
| Performance | Latency and packet loss |
| Traffic | Top interfaces by utilization |
| Hardware | CPU, memory, temperature |
| Alerts | Active warnings and critical events |
| Capacity | Long-term bandwidth trends |
Step 6: Configure Alerts
Set up notifications when important thresholds are reached.
Test each notification channel before relying on it operationally.
An alert that is never delivered is just as problematic as an alert that fires constantly.
Step 7: Review the Data
Continuous surveillance required: This is the general recommendation.
Keenly monitor alerts, clear out the unwanted checks. Look out for persistent GUI errors, bandwidth expansion, outages and devices constantly using up resource limits.
How to Choose Network Monitoring Software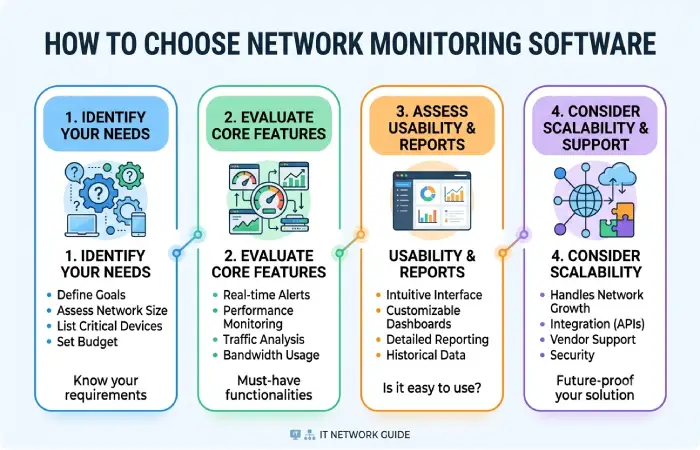
Let‘s examine how to choose network monitoring tools. The first thing is to define what the problem is.
A small office with several switches may only need availability, bandwidth, and basic alerting.
A large enterprise may need distributed monitoring, network topology, flow analysis, application visibility, cloud monitoring, role-based access, APIs, and advanced reporting.
Consider these factors before selecting a platform:
Network size: The total number of devices and interfaces that need to be found and tracked.
Implementation: Do you want the software to be hosted on site and maintained locally, monitored centrally via the internet or a blend of the two?
Protocol support : Does it support SNMP, APIs, agents, flow technologies and other data sources required by your equipment?
Alerting: Can you define thresholds, dependencies, escalations, and maintenance windows, define thresholds, dependencies, escalations, and maintenance windows?
Reporting: Should there be if the platform is utilized enough? Does the platform retain enough of the historical data, for on-going analysis or for troubleshooting?
Integration: Has consideration been given to integration with ticketing, messaging, incident management and automating systems?
Cost: Consider licensing and software costs,hardware, infrastructure,implementation, administration andmaintenance.
Technical skills: The open-source solution can be very flexible, but your team needs the skills to implement and maintain it.
Network Monitoring vs Network Management
Network monitoring and network management are related but different.
Monitoring primarily answers questions such as:
- Is the device available?
- How much traffic is flowing?
- Is packet loss increasing?
- Is an interface experiencing errors?
- Is the device overloaded?
In addition, network management covers more operational related activities such as configuration, provisioning, automation and inventory, policy enforcement, fault and configuration management.
A monitoring platform may be one component of a larger network operations strategy.
Final Thoughts
Network monitoring tools. They are the need to monitor the current IT infrastructure in order to maintain the visibility.
Free tools, such as Zabbix and Nagios Core, can offer the full range of functionality for organizations that are willing to take responsibility for system setup and administration. Zabbix will provide network metrics, discovery, alerting, history and automation capabilities, however Nagios Core has a flexible plugin based architecture.
Commercial platforms ease the deployment, and also execute provide additional dashboards, reporting, support, integrations and enterprise management.
Most important step, is not always picking the platform with the most extensive feature set. It is determining what devices, services and metrics are essential to your environment and also ensuring they are monitored.
Begin on a small scale, set valuable thresholds, minimize false alarms, gather historical data, and also increase broad coverage with the growth of your network.
What-to-do after it is configured right, network monitoring transforms network troubleshooting from a reactive task into a never-ending monitoring of visibility and also capacity management.